
Data analysis looks simple until you’re working with real-world data. A spreadsheet arrives with missing values. A dashboard doesn’t match the finance report. A stakeholder asks, “Why did this number change?” and suddenly your “quick analysis” turns into a long investigation.
The truth is that most data analysis mistakes are not dramatic. They are quiet. They don’t crash your tools. They don’t throw obvious errors. They just push your conclusions slightly off course until the final report tells a story the business shouldn’t trust.
If you work with data—whether you’re using Excel, SQL, Power BI, Tableau, or Python—this guide will help you spot common data analysis errors and fix them fast. You’ll also learn key data analysis best practices and practical habits for how to avoid data analysis mistakes before they ruin your reporting.
Table of Contents
- Why Data Analysis Mistakes Matter
- Quick Picks: Fast Fixes If You’re Busy
- Mistake Comparison Table
- 1) Skipping Data Cleaning
- 2) Using the Wrong Metrics
- 3) Correlation vs Causation
- 4) Ignoring Sample Size
- 5) Not Checking for Bias
- 6) Overcomplicating the Analysis
- 7) Poor Visualization Choices
- 8) Not Validating Results
- 9) Weak Communication of Insights
- A Practical Workflow to Avoid Data Analysis Mistakes
- AdSense + SEO Tips
- Internal + External Links
- FAQ
- Final Thoughts
Why Data Analysis Mistakes Matter
Data feels objective. That’s why people trust it. But here’s the uncomfortable truth: incorrect analysis can still look professional. A chart can be clean. A dashboard can be polished. The numbers can be formatted perfectly. Yet the conclusions can still be wrong.
When businesses rely on analytics to make decisions, even small data analysis mistakes can lead to wasted budgets, wrong priorities, and poor strategy. Over time, repeated errors create a trust problem. And once stakeholders stop trusting your work, they stop using it.
The goal isn’t perfection. The goal is a consistent process that reduces common data analysis errors before they reach your final report.
Quick Picks: Fast Fixes If You’re Busy
If you want the short version, these habits prevent most data analysis mistakes:
- Clean and validate your data before you analyze it.
- Define metrics in writing before calculating anything.
- Never treat correlation as proof of causation.
- Check sample sizes before making confident claims.
- Validate results using a second method or source.
- Use simple visuals that match the message.
- Communicate insights clearly with a takeaway and recommendation.
If you build these into your workflow, you’ll instantly improve accuracy and credibility—and you’ll spend far less time fixing issues later.
Mistake Comparison Table (Fast Overview)
| Mistake | Why It Happens | How to Fix It |
|---|---|---|
| Skipping data cleaning | Deadlines, assumptions, messy inputs | Use a repeatable cleaning checklist |
| Wrong metrics | No shared definitions | Create a metric dictionary |
| Correlation vs causation | Patterns feel like proof | Check confounders, test assumptions |
| Ignoring sample size | Small data still looks convincing | Add context, avoid strong claims |
| Bias in data | Missing segments or tracking gaps | Identify who’s missing and why |
| Overcomplicating | Trying to impress or unclear questions | Simplify and focus on decision-making |
| Bad visualizations | Wrong chart types or misleading axes | Use visualization best practices |
| No validation | Trusting tools blindly | Cross-check totals and edge cases |
| Poor communication | No “so what” or next steps | Summarize insights and recommendations |
1) Skipping Data Cleaning (Or Rushing Through It)
If you had to pick the most common source of data analysis mistakes, it would be skipping data cleaning. Real datasets are rarely ready to analyze the moment they arrive.
Why it happens
Cleaning feels like preparation, not “real analysis.” Under pressure, analysts often jump straight into charts and calculations.
What it looks like
- Duplicate rows that inflate totals
- Missing values that skew averages
- Dates stored as text that break time analysis
- Inconsistent categories such as “US” and “United States”
- Outliers that are clearly data errors
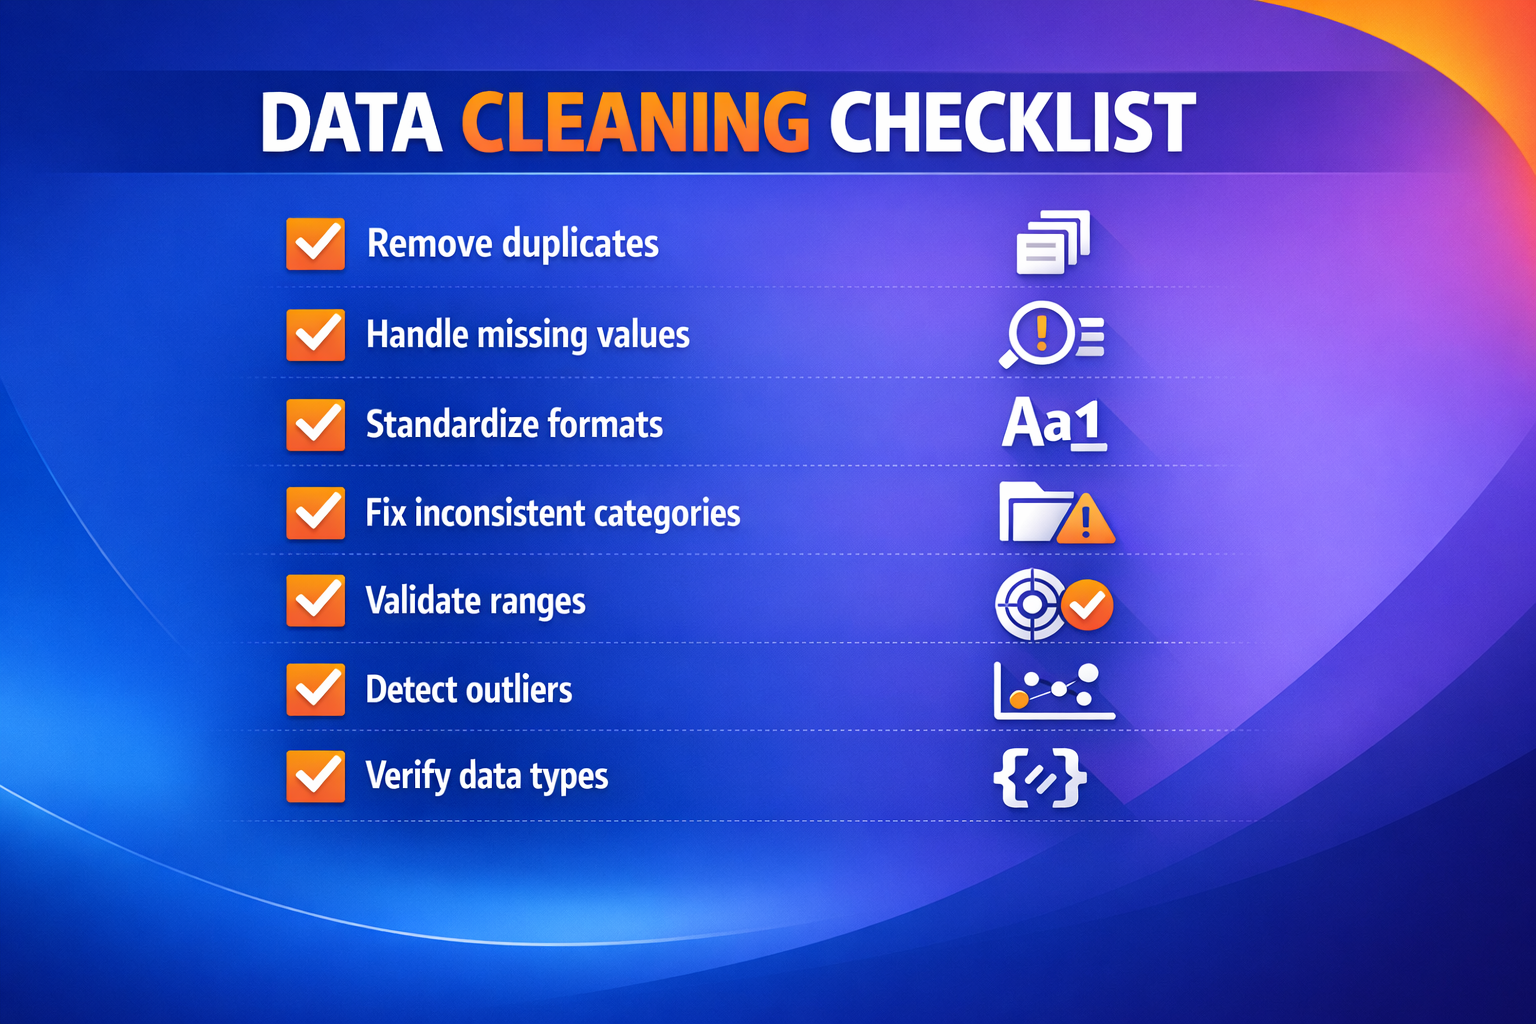
How to fix it
- Check missing values and decide whether to remove, fill, or flag them.
- Remove duplicates using clear rules (IDs, timestamps, key columns).
- Standardize formats for dates, currency, and text categories.
- Validate ranges (for example, negative ages or impossible values).
- Save a “cleaned dataset” version and analyze that, not the raw file.
Many analysts speed this up using modern tools to draft cleaning checklists, validate edge cases, or write quick scripts. If you’re interested in productivity tools that reduce repetitive work, you may find this guide useful:
7 Free AI Tools That Feel Illegal to Use in 2025.
2) Using the Wrong Metrics (Or Not Defining Them Clearly)
Metric confusion is one of the most damaging common data analysis errors because it creates disagreements instead of insights. Two people can calculate a KPI with the same name and still get different results.
Why it happens
Teams assume everyone uses the same definition. In reality, small differences in filters, time windows, or denominators change everything.
What it looks like
- A conversion rate that changes depending on who calculates it
- Revenue numbers that don’t match finance reports
- A KPI that shifts after a “small” filter adjustment
How to fix it
Create a simple metric dictionary with:
- Metric name
- Exact formula
- Source tables or systems
- Time window
- Filters and exclusions
This is one of the simplest data analysis best practices you can adopt. It also helps your work survive team changes, new dashboards, and new stakeholders.
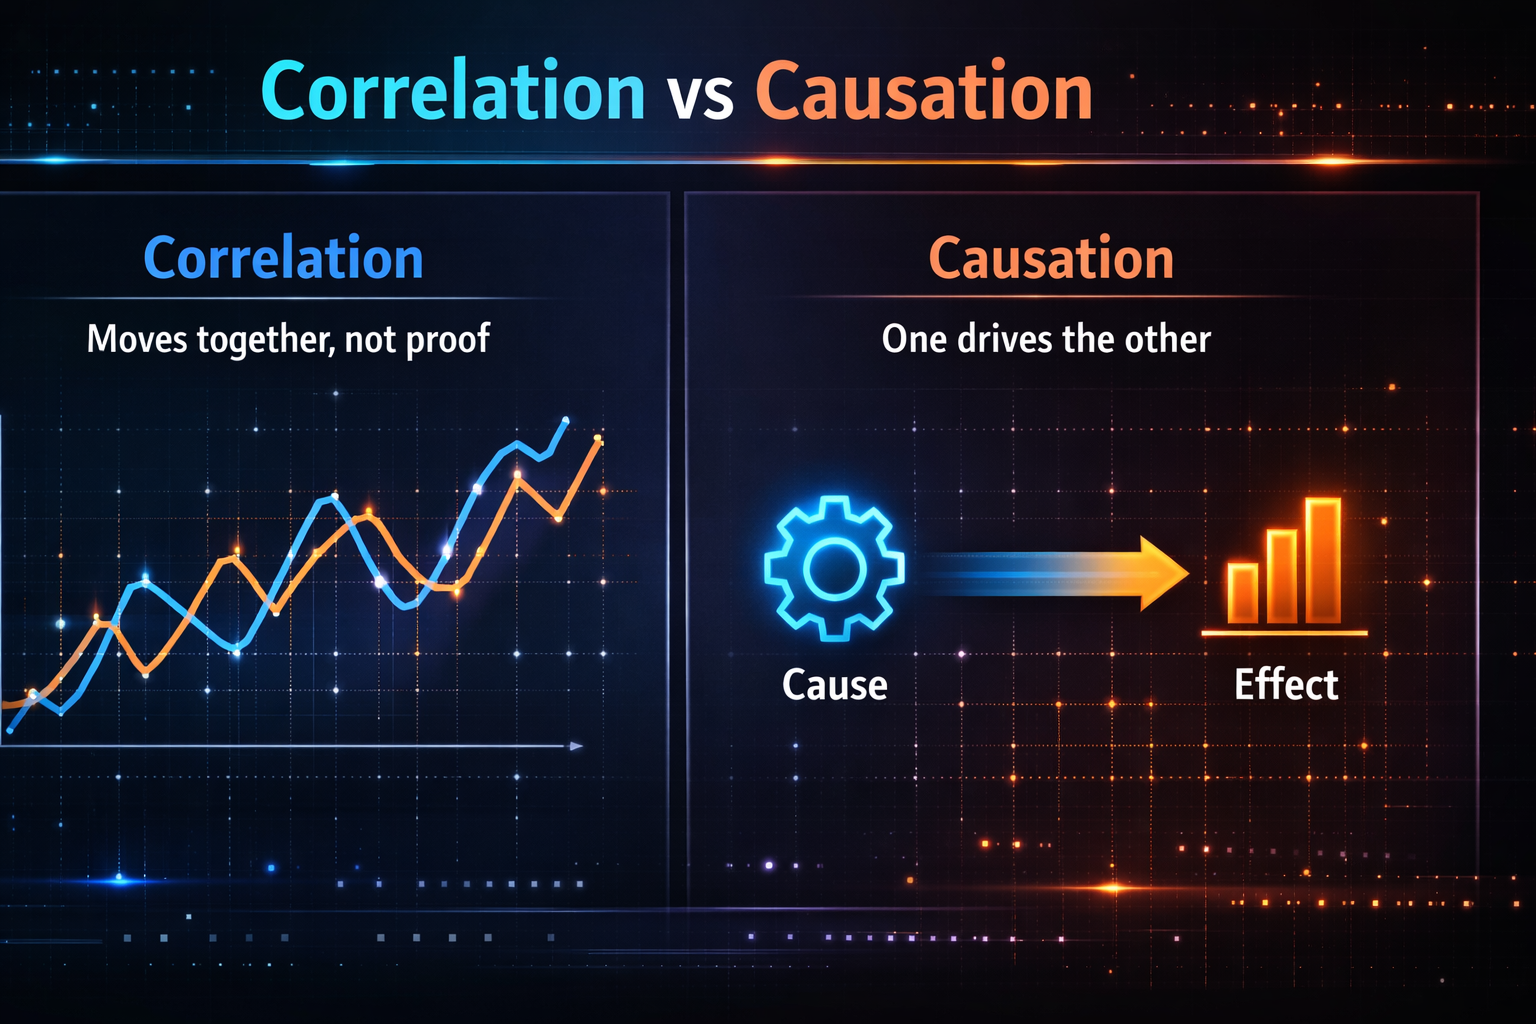
3) Confusing Correlation With Causation
This mistake happens when you see two things move together and assume one caused the other. Correlation only tells you there’s a relationship, not responsibility.
Why it happens
Humans love clean explanations. A chart that moves together looks persuasive, especially during presentations.
How to fix it
- Ask what other variables could explain the relationship.
- Check whether the trend holds across segments (region, channel, device).
- Look for time lag effects (did one change first?).
- If possible, confirm with experiments or A/B tests.
If you want to speed up research and explore multiple angles quickly, AI search tools can help you uncover potential confounders and related questions. You may like:
10 Best Free AI Tools Nobody Is Talking About (Yet).
4) Ignoring Sample Size (Small Data Can Mislead You)
Small sample sizes create unstable results. They can form trends that disappear the moment more data arrives. This is one of the most common reasons analysis “fails” after a few weeks.
Why it happens
Small datasets still produce clean charts and clear percentages, so they feel reliable.
How to fix it
- Always report sample size next to percentages.
- Avoid strong language when the sample is small.
- Compare results over longer time windows.
- Use confidence intervals when possible.
If you’re unsure, treat it as an early signal instead of a final conclusion. That’s a subtle but important part of how to avoid data analysis mistakes.
5) Not Checking for Bias in the Dataset
Even “accurate” data can be misleading if it isn’t representative. Bias often hides inside the data collection process.
Common sources of bias
- Only active users are included (missing churned users)
- Survey data reflects only one demographic
- Tracking events are missing on certain devices or browsers
- Some customer segments are underrepresented
How to fix it
- Ask who is missing from the data.
- Check how the data was collected and what it excludes.
- Compare key metrics across segments.
- Document assumptions and limitations.
Adding a short “limitations” section is one of those data analysis best practices that improves trust instantly.
6) Overcomplicating the Analysis
Complexity is not the same as value. If your analysis is too complicated to explain clearly, it’s too complicated to trust.
Why it happens
Analysts may feel pressure to impress, or the business question may be unclear from the beginning.
How to fix it
- Start with one business question and build around it.
- Use a small set of metrics that support decisions.
- Present the simplest explanation that is accurate.
- Add complexity only if it changes the recommendation.
If you create dashboards or reports regularly, productivity tools can help you spend less time on repetitive formatting and more time thinking. This guide is worth bookmarking:
17 Best AI Tools for Content Creators (Save 10+ Hours/Week). Many of the tools also apply to analysts who write reports or build presentations.
7) Poor Data Visualization Choices
Bad visualization can make correct numbers feel misleading. And misleading charts can create the wrong response from stakeholders.
Common visualization mistakes
- Truncated axes that exaggerate trends
- Pie charts with too many categories
- Missing labels and unclear units
- Too many colors and distractions
How to fix it
- Use bar charts for comparing categories.
- Use line charts for trends over time.
- Label axes and include units.
- Use consistent scales across charts.
As a rule, one chart should deliver one message. If the message isn’t clear in a few seconds, simplify the chart.
8) Not Validating Results Before Publishing
Many data analysis mistakes happen because analysts trust tool outputs without verifying them. SQL queries, spreadsheets, and dashboards can all produce results that look correct but are logically wrong.
How to fix it
- Compare totals to previous periods.
- Check whether values fall within realistic ranges.
- Cross-check using another method or source.
- Test edge cases (one user, one segment, one day).
If a number surprises you, treat that as a signal to validate, not proof that you found something “amazing.”
9) Weak Communication of Insights
Your analysis is only valuable if your audience understands it. A report without a clear takeaway often gets ignored, even if the work behind it was excellent.
How to fix it
Use this structure in your report or dashboard summary:
- What we found
- Why it matters
- What we recommend
- Next steps
Also consider adding a short executive summary at the top. A few strong bullet points often outperform long paragraphs.
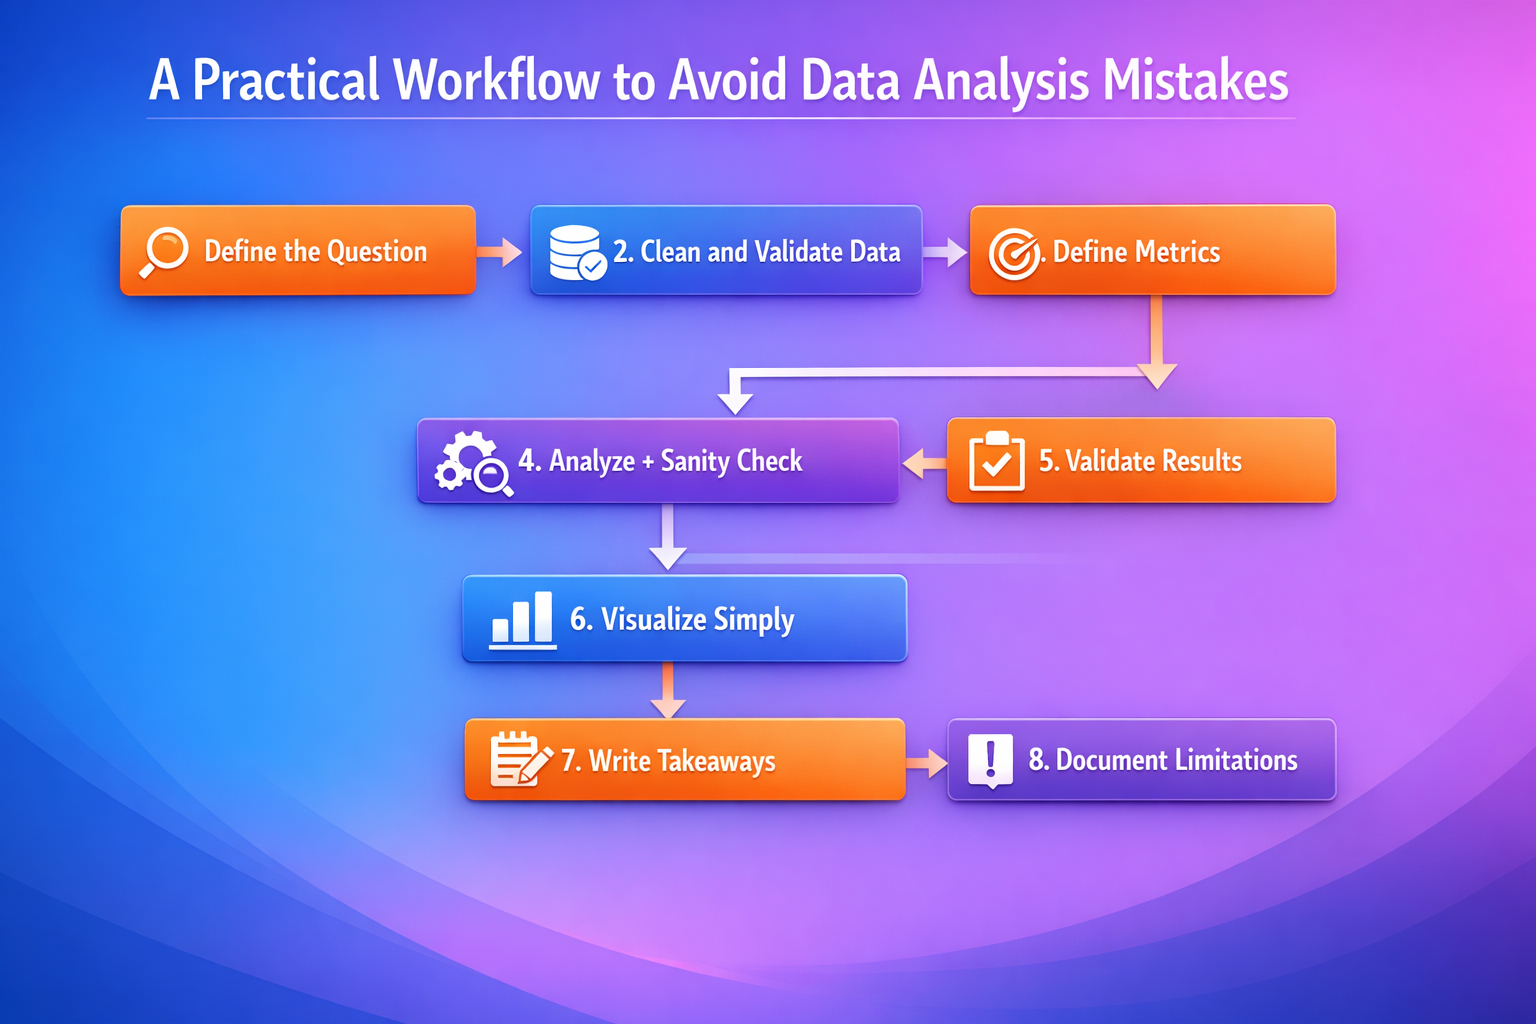
A Practical Workflow to Avoid Data Analysis Mistakes
If you want a repeatable system that reduces errors, use this workflow:
- Define the question: What decision will this analysis support?
- Clean and validate: Fix missing values, duplicates, formatting issues.
- Define metrics: Write formulas, filters, and time windows before calculating.
- Analyze and sanity check: Look for impossible values or sudden spikes.
- Validate results: Compare with another source or run a second calculation.
- Visualize simply: Use the right charts and label everything clearly.
- Write the takeaway: Summarize the insight and recommendation in plain language.
- Document limitations: Include what might affect interpretation.
This workflow is simple, but it covers the core of how to avoid data analysis mistakes in real projects.
AdSense + SEO Tips (Increase RPM and Rankings)
If your goal is search traffic and AdSense revenue, structure matters. These improvements often increase time on page, ranking potential, and ad performance:
- Use scannable formatting: short paragraphs, bullet lists, and clear headings.
- Add a table early: it keeps readers engaged and improves readability.
- Use internal linking: link to relevant articles so users explore more pages.
- Add 1–2 images or charts: visuals improve user experience and retention.
- Use high-intent subtopics: data cleaning, SQL mistakes, KPIs, and dashboards attract motivated visitors.
- Avoid thin content: add real examples, specific fixes, and clear recommendations.
AdSense also prefers original and helpful content. This article is designed to be practical, not generic. That’s exactly the kind of content that performs well long-term.
Internal + External Links
Internal links (Published posts from our site)
- 7 Free AI Tools That Feel Illegal to Use in 2025
- 10 Best Free AI Tools Nobody Is Talking About (Yet)
- 17 Best AI Tools for Content Creators (Save 10+ Hours/Week)
- 7 Powerful Ways AI Is Changing Everyday Life
External links (Authority resources)
- Google Search Central: SEO Starter Guide
- Microsoft Excel Support and Documentation
- PostgreSQL Official Documentation
- Tableau: Data Visualization Resources
- NumPy Documentation
FAQ
What are the most common data analysis mistakes?
The most common data analysis mistakes include skipping data cleaning, using unclear metric definitions, confusing correlation with causation, ignoring sample size, and failing to validate results before reporting.
How can I avoid common data analysis errors?
You can avoid most common data analysis errors by following a repeatable workflow: clean and validate your data, define metrics clearly, cross-check results, use clear visuals, and communicate insights using simple language and actionable recommendations.
Why are data analysis best practices important?
Data analysis best practices reduce errors, increase trust, and help you work faster because you spend less time fixing mistakes later.
Do data analysis mistakes affect business decisions?
Yes. Even small errors can lead to wrong conclusions and wasted budgets. That’s why validation and clear communication are essential parts of professional analysis.
Final Thoughts
Most analysis mistakes happen because people rush, rely on assumptions, or skip validation. But once you build a consistent process, you can prevent most data analysis mistakes before they reach your dashboards and reports.
If you want a simple next step, choose one mistake from this list and apply the fix in your next project. Better analysis isn’t about being perfect. It’s about being consistent, careful, and clear.